Boston Solar logo

Our Gallery

Contact Boston Solar

12 Gill St. Suite 5650 Woburn, MA 01801

info@bostonsolar.us

617-858-1645

Category: Uncategorized

Read More

The Complete Guide to BERDO 2.0 Compliance: How Boston Commercial Property Owners Use Solar to Eliminate Penalties and Decarbonize

Businesses in Boston can navigate BERDO 2.0 compliance with solar energy solutions. Learn how to reduce building emissions effectively and sustainably.

Read More

Understanding Boston BERDO Alternative Compliance Payments and Fines: Real Financial Implications of Non-Compliance

Understanding BERDO alternative compliance payments is crucial for Boston businesses. Learn about penalties and costs of non-compliance to avoid hefty fines.

Read More

Understanding BERDO 2.0 Timelines and Building Size Thresholds for Massachusetts Emissions Reporting

Learn the key emissions reporting timelines for BERDO 2.0 and ensure compliance. Stay informed and prepare effectively for upcoming regulations.

Read More

BERDO Compliance Requirements for Commercial Solar in Boston: A Clear Guide for Property Owners

Unlock the potential of Boston’s commercial solar projects with key BERDO requirements. Enhance sustainability and comply with regulations for a greener future.

BERDO Compliance: Deadlines, Fines, and What Boston Building Owners Have to Do

A property developer called us recently, close to panicked. He had heard about BERDO, understood that fines were part of it, and wanted to know what he was supposed to be doing.

He’s not the only one. If one owner is worried enough to pick up the phone, plenty of others are sitting on the same question and haven’t asked it yet.

So here’s the whole thing, start to finish, without the consultant-speak. What BERDO is, whether it covers your building, what your building’s actual number is, what happens if you go over it, and where solar fits in.

What is BERDO?

BERDO stands for the Building Emissions Reduction and Disclosure Ordinance. It’s Chapter VII, Section 7-2.2 of the Boston city code, and it requires large existing buildings to report their annual energy and water use, verify that data through a third party, and keep their greenhouse gas emissions under an annual limit that drops every five years until it hits zero in 2050.

Put more simply: the City tells you how much carbon your building is allowed to put out each year, that number shrinks over time, and you have to prove you stayed under it.

The original ordinance passed in 2013 as a reporting rule. Nothing more than paperwork. The City Council rewrote it in September 2021, and that version, the one people call BERDO 2.0, is what added the actual emissions limits and the money attached to missing them.

Boston isn’t doing this for symbolic reasons. According to the City, about 5% of Boston’s buildings produce nearly 40% of the city’s carbon emissions. That is a small number of properties emitting more than every car, truck, and train in the city combined in a given year.

Does BERDO apply to my building?

Three categories, and you only need to fit one:

  • Residential buildings with 15 or more units
  • Non-residential buildings that are 20,000 square feet or larger, excluding parking
  • Any tax parcel with multiple buildings that add up to at least 20,000 square feet or 15 units

One detail that trips people up on mixed-use properties: your building counts as residential if 50% or more of its gross floor area, excluding parking, is residential. That matters, because residential and commercial buildings get different emissions limits.

If you want to confirm, the City maintains a public BERDO Covered Buildings List with every property and its BERDO ID.

What am I actually required to do?

Report every year. You submit last year’s energy and water use through ENERGY STAR Portfolio Manager, then complete the BERDO Reporting Form with the data tied to emissions compliance. The standing deadline is May 15. The City extended the 2026 deadline to August 15, which has now passed, so if you missed it the clock is already running.

Verify your data. You hire a qualified third-party energy professional to check your numbers. This is required in your first reporting year, in your first emissions compliance year (2026 or 2031), and every five years after that.

Stay under your emissions limit. This is the part with real money behind it, and it starts in different years depending on how big you are.

When do the emissions limits start for my building?

Starting with the 2025 calendar year (reported in 2026): non-residential buildings 35,000 square feet and up, and residential buildings with 35 or more units.

Starting with the 2030 calendar year (reported in 2031): non-residential buildings between 20,000 and 34,999 square feet, and residential buildings with 15 to 34 units.

If you’re in the second group, you still have to report every year right now. You just aren’t being measured against an emissions cap yet. Five years feels like a long runway. It isn’t, once you factor in how long boiler replacements and roof work actually take to plan and fund.

What is my building’s emissions limit?

Your limit depends on what the building is used for, and it is measured in kilograms of CO2 equivalent per square foot per year. Think of it like a speed limit sign that gets swapped out for a lower number every five years, and the road ends at zero in 2050.

Here’s what a few of the common use types look like, straight from Table 1 of the ordinance:

Building use2025-20292030-20342035-20392040-20442045-20492050+
Office5.33.22.41.60.80
Multifamily housing4.12.41.81.10.60
Retail7.13.42.41.50.70
Assembly7.84.63.32.11.10
Lodging5.83.72.71.80.90
Healthcare15.410.07.44.92.40
Technology/Science19.211.17.85.12.50

There are 13 use types in the full table. If your building has more than one primary use, and each one takes up at least 10% of the square footage, you can apply for a blended standard that mixes the limits together.

Notice the jump between the first two columns. An office building’s allowance drops about 40% in 2030. Whatever plan you build should be aimed at that column, not the one you’re sitting in now.

What happens if I go over?

There are two very different things people lump together here, and the difference is worth understanding.

Alternative Compliance Payments are not fines. An ACP is a legitimate compliance mechanism written into the ordinance. If your building is over its limit, you can pay $234 for every metric ton of CO2e you went over, and you’re considered compliant. That money goes into the Equitable Emissions Investment Fund, which pays for decarbonization work in Boston’s environmental justice communities. The ordinance set that $234 figure at the start and the Review Board revisits it every five years.

Fines are what happens when you ignore the process. Miss your reporting deadline and each day counts as a separate violation, at $300 a day for the larger buildings and $150 a day for the smaller ones. Blow past your emissions standard without using any compliance mechanism, and it’s $1,000 a day for larger buildings, $300 a day for smaller ones. Report numbers that your third-party verifier contradicts, and that carries a $1,000 to $5,000 penalty.

You get a 30-day cure window after a notice of violation before any penalty is assessed. But unpaid fines can end up as an assessment on your tax bill or a lien on the building.

So the honest math for a lot of owners is this: ACPs are cheaper than fines, and doing nothing at all is the most expensive option on the board.

Where does solar fit into all of this?

BERDO gives you three ways to comply. Cut your energy use, obtain renewable energy, or make Alternative Compliance Payments. Solar lives in the middle one, and it has a real advantage over the other renewable options.

Here’s the rule that matters most: on-site solar located behind the meter is always eligible under BERDO, with no MA Class I REC retirement required. Rooftop solar on your own building, wired directly into your electrical system, counts. No brokers, no NEPOOL retirement paperwork, no annual purchase to remember.

That’s not true of every option. If you buy solar net-metering credits from an array somewhere else, the rules get more specific. Credits from a system inside Boston are fine without retiring RECs. Credits from a system in Eversource’s Eastern Massachusetts territory are fine without RECs only if the array started operating before 2024 and you started receiving credits before 2024. After that, you need to retire the associated MA Class I RECs, or request a solar exemption from the Review Board.

How much of my emissions can solar cover?

Under BERDO, renewable energy applies to the emissions from your building’s electricity use. So the more of your building that runs on electricity, the more ground solar covers for you.

That’s useful to know early, because it shapes the order you do things in. If your heat and hot water still run on natural gas or oil, that share of your footprint gets handled through equipment upgrades rather than through renewables. Most buildings end up walking the same path: electrify heating and hot water as the existing equipment reaches end of life, tighten up the envelope, and put solar behind the new electric load so the emissions do not simply move from the gas meter to the electric meter.

Solar is usually the easiest piece to start with, and it’s the one that keeps paying you back while you plan the rest.

One more thing working in your favor. The grid is getting cleaner underneath you. Massachusetts requires electricity suppliers to add more renewable energy every year under the Renewable Portfolio Standard, and BERDO builds that into its emissions math. Your electricity emissions drop a little each year even if you do nothing at all.

Why not just buy RECs every year?

You can. Plenty of owners do, and the City runs a MA Class I REC Connector Program to make it easier.

But compare what you own at the end. RECs are an operating expense that comes back every single year, and the price is whatever the market says it is that year. A solar array is a capital asset that sits on your building, produces power you’d otherwise buy from Eversource or National Grid, and keeps offsetting your BERDO emissions for 25 years or more. One is rent. The other is equity.

There’s also a timing element. The federal commercial investment tax credit currently requires projects to be placed in service by December 31, 2027, and Massachusetts is issuing SMART 3.0 statements of qualification following the DPU’s tariff approvals in 2026. Commercial solar projects take time to design, interconnect, and build. The buildings that get the best economics on their BERDO compliance are the ones starting the conversation now rather than in 2029.

How can Boston Solar help?

We’ve been installing solar in Massachusetts since 2011, with more than 7,500 systems in the ground. Our commercial team works with property management companies, apartment portfolios, and small businesses across Boston and New Hampshire.

For a BERDO building, we can look at your reported energy data, size a system against your actual electric load, tell you honestly how much of your emissions gap solar can close, and handle interconnection with Eversource or National Grid from application through permission to operate. If solar only gets you part of the way, we’ll say so, and we’ll tell you what the number looks like.

Compliance isn’t going away and the limits only get tighter. The buildings that plan for the 2030 column now are the ones that won’t be scrambling.

Get a commercial solar assessment for your Boston building.


Sources: City of Boston Building Emissions Reduction and Disclosure Ordinance (CBC Chapter VII, Section 7-2.2, as amended September 22, 2021); boston.gov/berdo BERDO 101, Emissions Compliance, and Renewable Energy quick guides; City of Boston MA Class I REC Connector Program page. Verified August 21, 2026.

Read More

Understanding Solar Panel Efficiency in New England | Maximize Energy Output

Homeowners in New England can maximize energy savings by understanding solar panel efficiency. Learn key insights for improved performance and sustainability.

Read More

Get Solar Battery Storage in MA | Power Outage Protection & Savings

Maximizing savings is possible with solar battery storage in Massachusetts. Learn how to reduce energy costs and boost efficiency effortlessly.

Read More

Why Is the Sky Yellow, and What Is It Doing to Your Solar Panels?

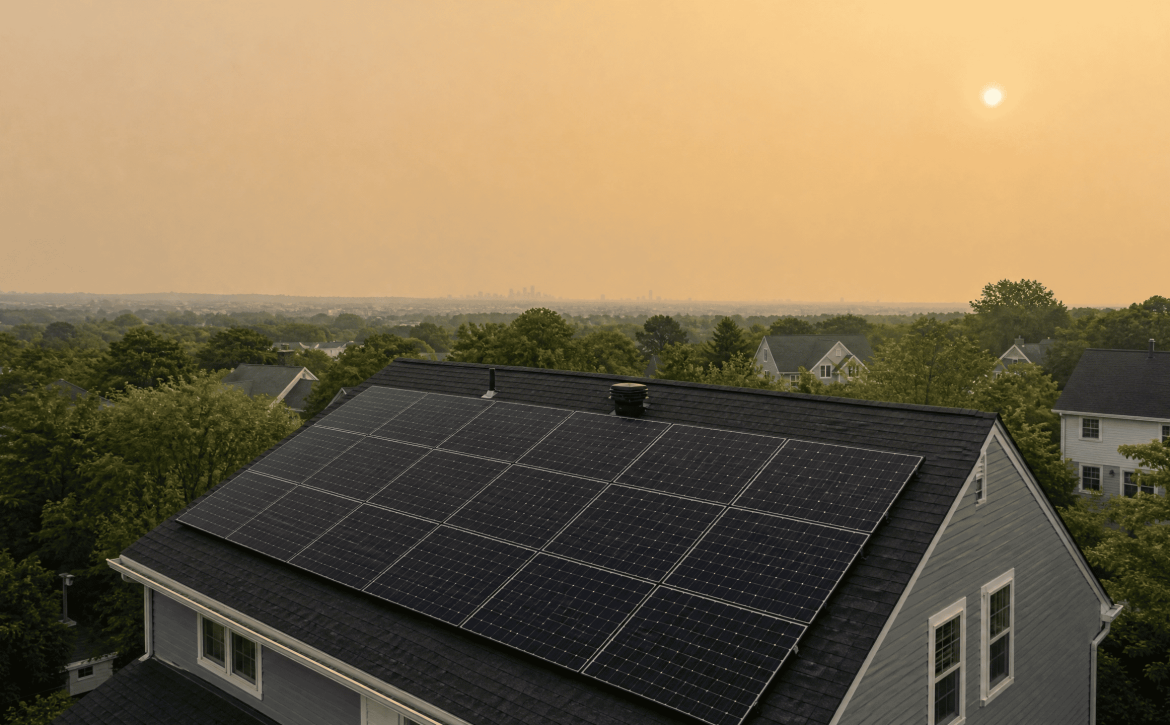
If you looked up over New England on Tuesday afternoon and thought something was off, you weren’t wrong. The sky went from summer blue to a milky white to a sort of brownish-yellow over the course of a few hours, and the sun turned into a dull orange disc you could look at without squinting.

That’s Canadian wildfire smoke. And if you own solar panels, your monitoring app almost certainly noticed before you did.

Here’s what’s actually going on, what it means for your production numbers, and what’s worth doing about it. Spoiler on that last part: less than you’d think, but not nothing.

Where is this smoke even coming from?

Where is this smoke even coming from?

Not from anywhere close by, which is the part that surprises people.

There are currently more than 800 wildfires burning across Canada, including a growing cluster just north of the U.S. border near Minnesota. Upper-level winds lined up almost perfectly to carry the plume more than 1,000 miles, first across southern Canada and then hooking right, straight into New England. According to the Canadian Interagency Forest Fire Centre, 32 wildfires sparked across mostly western Ontario on Monday, with 46 burning out of control across the province.

The setup is a heat dome. Air flows clockwise around these big, slow-moving high-pressure systems, and this week’s is parked with its northern edge sitting right over northern Minnesota and southern Ontario where the fires are. That placement pushes the smoke east and south, into the Midwest and Northeast.

So nothing is burning in Massachusetts. The fires are a thousand-plus miles away and the smoke is doing the commuting.

What is the smoke actually doing to sunlight?

This is where it gets relevant to your roof.

Solar panels care about irradiance, which is the amount of solar energy landing on a given area of surface. There are two flavors of it worth knowing. Direct normal irradiance (DNI) is the light coming straight at you from the sun in a beam. Global horizontal irradiance (GHI) is everything that reaches a flat surface, the direct beam plus all the light that’s been scattered around the sky.

Put more simply: DNI is the sunbeam, GHI is the sunbeam plus the glow.

Smoke wrecks the first one a lot more than the second. A 2025 study in Nature Communications found that during days of thick smoke, clear-sky DNI in California declined 32–42%, while GHI only declined 11–17%. That gap matters, because GHI is the main resource your rooftop panels are running on.

Think of it like a lampshade. Put a thin white shade over a bare bulb and the room doesn’t go dark, the light just stops coming from one hard point and starts coming from everywhere at once. Your panels don’t need the beam specifically. They’ll take the glow. They just take less of it.

WBUR described the layer as acting like a giant, semi-translucent sponge, filtering and scattering the incoming solar radiation. That’s the mechanism, and it’s also why the sky looks the way it does. Smoke particles scatter the shorter wavelengths — the blues and violets — while the longer wavelengths, the reds and oranges, punch through. Same physics as a sunset, running at 2 p.m.

How much production are you actually losing?

Depends entirely on how far you are from the fire. That’s really the whole answer.

For systems near an active fire, it’s brutal. The Department of Energy cites research showing that during the September 2020 California wildfires, PV output declined 10% to 30% statewide but dropped as much as 58% locally. Across a set of monitored sites in the western U.S., wildfire smoke caused a measured drop of 9.4% to 37.8% in power production.

But we’re not near the fire. We’re the far end of a 1,000-mile plume, and that’s a meaningfully different situation. The Nature Communications team found that large GHI reductions are possible close to fires, but average GHI declines minimally — under 5% — from transported smoke. Their headline takeaway was that average PV resource losses stay modest outside the areas immediately near active fires, where plumes are thick and fresh.

One study modeled it city by city and the numbers are worth sitting with: during the heavy smoke year of 2020, panels near the fires in Modesto, California could have produced 11% less than normal, while farther out the effect shrank — Denver at 3%, New York at 1%.

That’s the annual figure though, and this is where people get confused. A 1% hit spread across a year is not the same as what your app shows you on a single bad afternoon. On the day, under a thick plume, the dip is real and you’ll see it. Averaged over twelve months, it mostly disappears into the noise.

So both things are true. Today stings. The year probably won’t.

One more wrinkle worth knowing, because it explains why you can’t just eyeball the air and guess: research from South Dakota Mines found that widespread smoke can cut individual panel output substantially even on days when the smoke is high up and ground-level air quality isn’t significantly affected. The smoke doesn’t have to be in your lungs to be in the way of your panels. Which is exactly what’s happening this week — in New England, most of the smoke is expected to stay at higher altitudes.

What does this do to the grid?

This is the underrated part of the story, and New England has been through it before.

When smoke blanketed the region in June 2023, ISO New England — the regional grid operator — saw it immediately. “At a simple level, the smoke is inhibiting the solar power from hitting the panels and generating electricity,” ISO-NE spokesperson Matt Kakley told WBUR at the time.

Here’s the twist. Because most solar in New England is “behind the meter” — on rooftops, used directly in the home — when production drops, demand on the regional grid goes up. But the smoke also held temperatures lower than forecast, so people ran their AC less and used less electricity than expected. Two conflicting things at once.

And ISO-NE’s forecasting models weren’t built for it. “When we forecast demand on the system, we’re looking at historical data,” Kakley said. “And the challenge with something like this is that there’s just simply not the historical data that you would have to look back on.”

ISO-NE’s own summer 2023 recap put it plainly: smoke from Canada significantly diminished the region’s solar production, the haze pushed temperatures below what models forecast, and together those two factors made forecasting grid demand quite challenging. Forecasters adjusted their modeling and the grid operated normally.

The scale has changed since then, which is why this keeps mattering more. New England had less than 80 MW of solar in 2010. By the end of 2025 the six-state region was at roughly 9,600 MW, producing an estimated 11,600 GWh that year. The region now has more than 8,000 MW of behind-the-meter PV, projected to cut peak-hour demand by more than 1,700 MW this summer.

You can see the same collision happening right now. The smoke absorbed enough of Tuesday’s peak heating to hold temperatures 5 to 10 degrees below forecast — Boston hit 90 against a forecast 97. CBS Boston lowered Wednesday’s forecast highs by several degrees and lifted its heat alert because of it. Less sun on the panels, less heat driving the AC. The grid feels both.

Okay, so what can you actually do?

Straight answer first: there is no trick that makes a panel see through smoke. Anyone selling you one is selling you something. But there are a few real moves, and a couple of things that are worth not doing.

Don’t clean your panels for this. This is the big one, and it’s where advice written for California gets misapplied out here. Cleaning helps when there’s physical ash sitting on the glass. Ash from wildfire smoke landing on panels is a real problem and hosing it off brings the system back toward peak production. But that’s for people who live near the fire and are getting actual fallout. We’re getting smoke aloft from a thousand miles away, not ashfall. There’s nothing on your glass to remove. Climbing on a hot roof in bad air to wash off a haze that’s in the atmosphere is all risk and no return.

Don’t panic at your monitoring app. A dip on a smoke day is your system working correctly. It’s reporting less sun because there’s less sun. One useful benchmark from a California installer: if you notice production has dropped more than 50%, that may be a technical issue or system failure rather than the weather. Short of that, a bad afternoon under a plume is expected behavior, not a fault.

Shift your heavy loads. If the middle of the day is producing less than normal, that’s the window where you’re pulling more from the grid instead of your roof. Dishwasher, laundry, EV charging — moving those to a clearer day or overnight is small, but it’s free and it’s the only lever most people have on a smoke day.

Watch the pattern, not the day. This is the one that actually matters, and it’s the reason to pay attention at all. CNN notes that with several months left in wildfire season, the door stays open for more Canadian smoke plumes to migrate south. The Globe pointed out that Tuesday’s haze was reminiscent of the last two summers, when heavy Canadian smoke drifted into the Northeast. This plume will move on. The pattern that produced it won’t.

Is this the case for a battery?

It’s at least worth thinking about, and here’s the honest version of why.

A battery doesn’t help your panels produce in smoke. Nothing does. What it does is decouple when you make power from when you use it. Your system banks the good hours and you draw on them during the bad ones instead of buying from the grid at the exact moment everyone else in the region is doing the same thing.

That’s not a smoke solution specifically. It’s an intermittency solution, and smoke is just this week’s version of intermittency. In 2023, ISO-NE noted the diminished solar production didn’t threaten grid reliability, partly because solar wasn’t yet a huge share of New England’s electricity. That’s less true every year. The more of the region’s power that comes off rooftops, the more a few smoky days in July actually move.

Storage is also the answer to a problem smoke days don’t cause but grid stress does: grid-connected solar panels without batteries don’t work if the power goes out.

The short version

  • The smoke is from Ontario and Minnesota fires, carried 1,000+ miles by upper-level winds around a heat dome.
  • It scatters sunlight rather than blocking it outright, so your panels lose some output but don’t stop.
  • Near a fire, losses run 10–30% and can hit 58% locally. This far downwind, the annual average impact is a few percent or less.
  • A single smoke afternoon still shows a real dip in your app. That’s normal, not a malfunction.
  • Don’t clean your panels. We’re getting haze aloft, not ash on glass.
  • Fire season runs for months. The plume leaves, the pattern stays.

Your system is fine. It’s doing exactly what a solar array does when there’s less sun: making less power, and then making full power again when the sky clears. That’s the whole story on the equipment side.

The longer story is that New England is now on its third straight summer of this, the region’s solar fleet has grown from 80 MW to nearly 10,000 MW in fifteen years, and the grid operator is openly saying its models don’t have the historical data for it. That’s not a reason to worry about your panels. It is a reason to think about where your power comes from at 3 p.m. on a yellow-sky day.

If you’re curious what that looks like for your specific roof — what you’re producing now, and whether storage makes sense for your usage — we’re happy to walk through the numbers with you. No pressure either way. Sometimes the answer is that you’re already in good shape.


Sources: WBUR, Boston Globe, CBS Boston, CNN, FOX Weather, Nature Communications, U.S. Department of Energy, ISO New England, Solar Power World, Palmetto.

How to Find a Certified Solar Technician for Repairs: 5-Step Guide 2026

Need solar repairs but your installer is out of business? Follow our 5-step guide to finding certified technicians in Massachusetts and New Hampshire for 2026.

How to Identify a Failing Solar Circuit Breaker: 5-Step Guide 2026

Learn how to use solar monitoring data to identify a failing circuit breaker. Our 5-step guide for 2026 helps you diagnose outages and restore solar production.